Tableau "No Data to Display" Warning Message
Intro
As we discussed before, the best way to prevent blank graphs is to take away users' ability to select mutually exclusive filter options. But what if your visualization requires that you keep all filter options available all the time? Perhaps you don't want to mislead your audience into thinking that there are less filter options than there really are.
In this case, you can turn to more creative ways to make sure that the audience is not confused by graphs going blank.
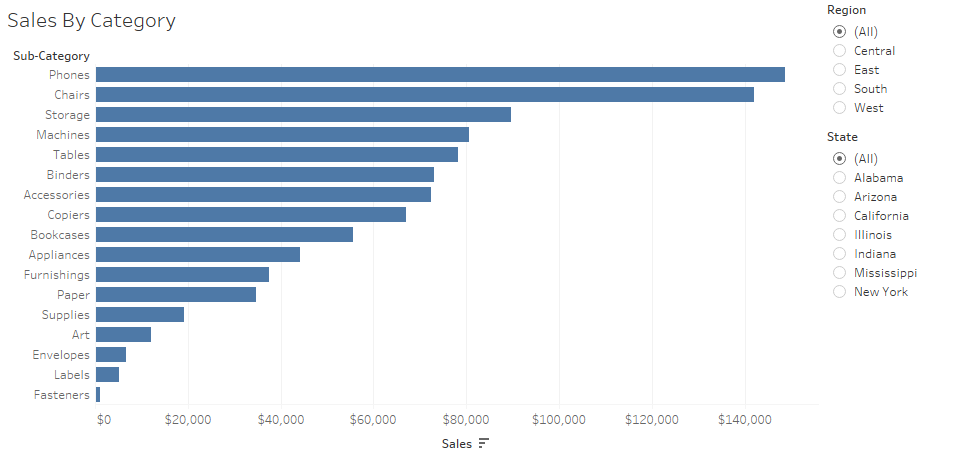
To further expand on this idea, consider the dashboard below, showing a mock company's sales across various categories. Note that there are several values within the filters that are mutually exclusive, such as "East" and "California" or "West" and "Indiana".
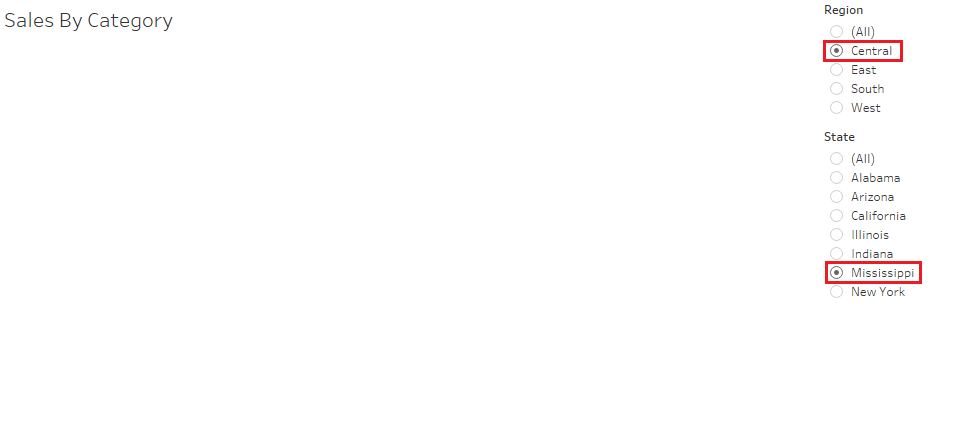
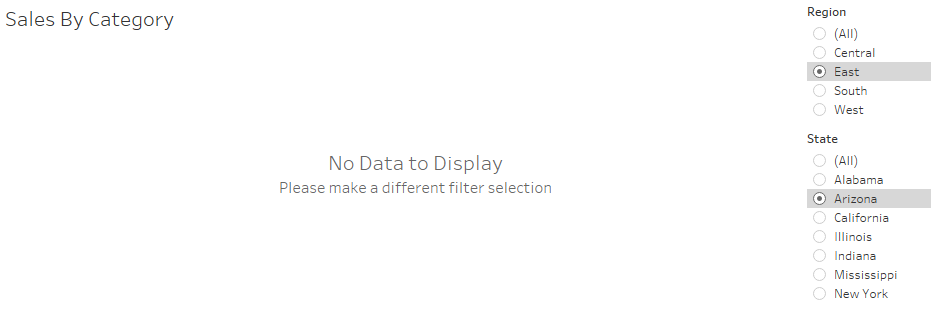
Just like in part 1 of the series, when two mutually exclusive values are selected, the graph goes blank. This is just Tableau telling the user that there is no data to display under the current filter selections. This, however, can be quite confusing, especially if the audience is not familiar with the subject matter of the visualization.
In this tutorial, I will go over how to create a message (shown below) that lets the audience know that they've selected incompatible filter options.
Instructions
Unfortunately this solution is not standard functionality in Tableau, so we have to get creative.
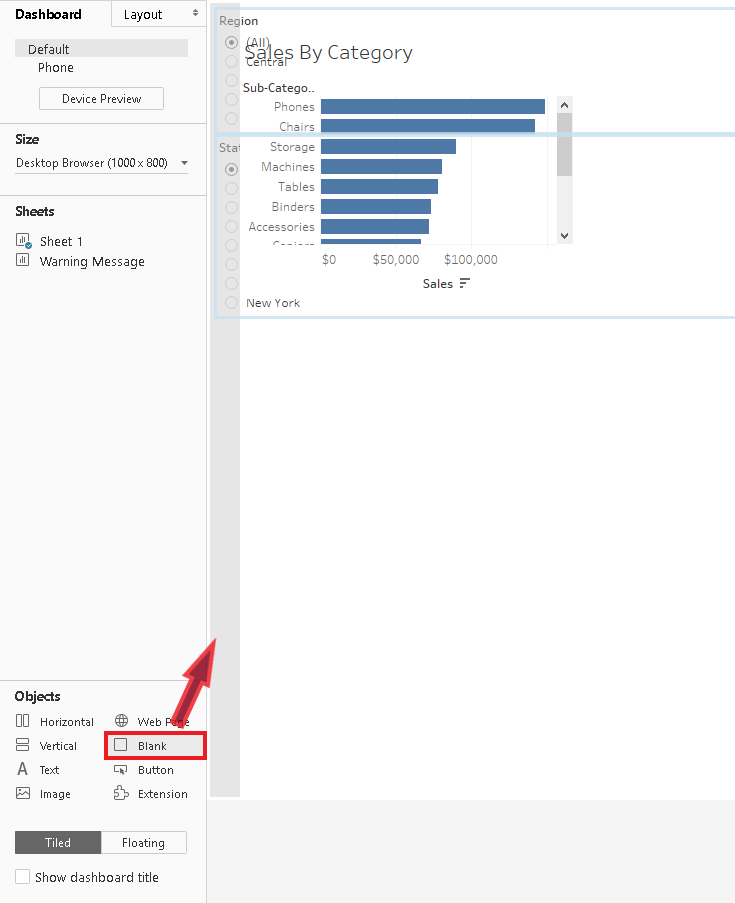
- The first step is to make your main visualization in your dashboard "floating". This will remove the graph from the dashboard's layout structure and superimpose it on top.
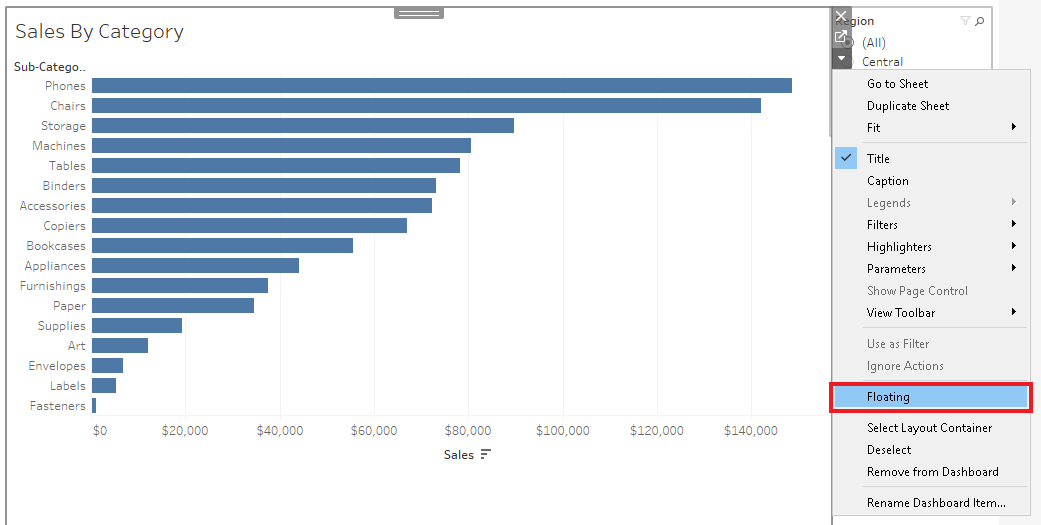
- Below is what you should see once your graph is converted to "floating". Where there once was a bar graph in the dashboard layout structure, there is now nothing, and that's why the filters have moved over to the left of the dashboard, underneath the bar graph. To put the filters back in their place, drop a blank container into the structure as shown below.
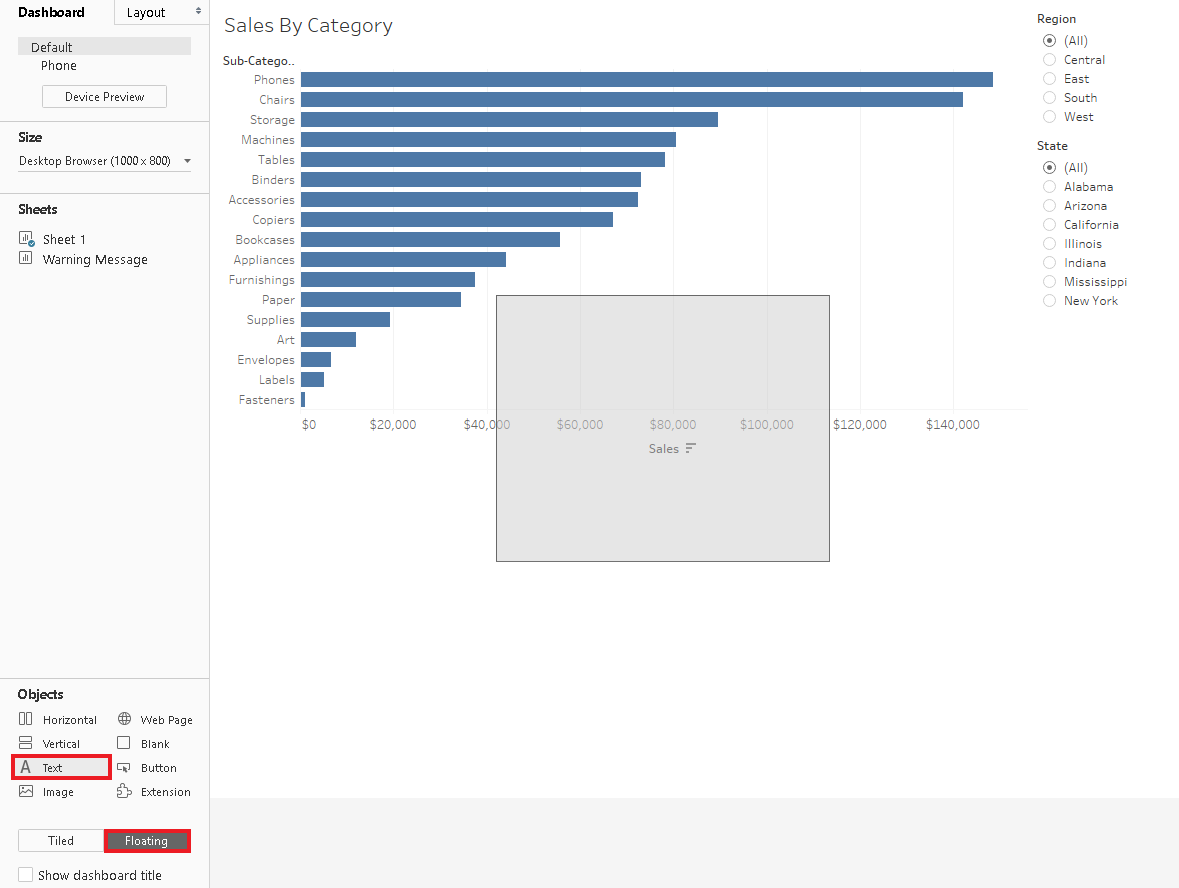
- After adjusting the blank container's size to move the filters bank into their place and resizing the now-floating bar graph to put it in the same place as before, you should be left with something that looks like the dashboard below. The next step is to drop a floating Text object onto the dashboard, as shown below.
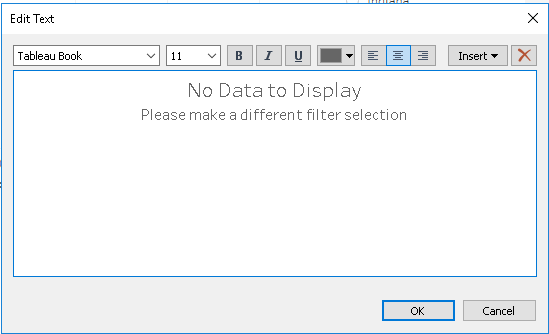
- Write your preferred message in the Text object.
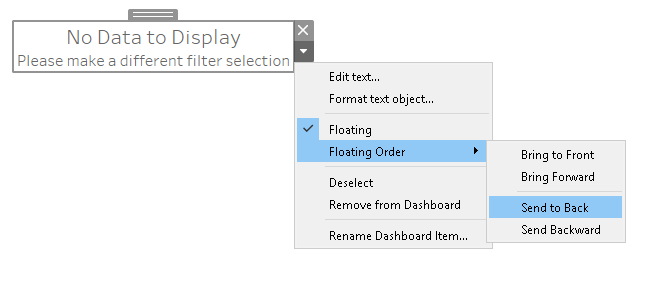
- Send the Text object to the back of the floating order, which puts the object "underneath" all other objects in the dashboard.
Results
Following these instructions should result in a dashboard that looks and functions normally but also has a hidden warning message that only gets displayed when the bar graph goes blank, as shown below.


If you have any questions about this visualization, or would like to share Tableau Tips & Tricks of your own, contact [email protected]